Exercise: Create a Web Dashboard
Let’s create a new page within the Web dashboard website for designations.
Step 1 - Navigate to the Web Dashboard web site.
Select the Web dashboard task within the Analysis functional area to navigate to the website within the Infinity shell.
After the Web Dashboard page appears, select Open in browser within the Tasks action group on the left hand side of the page.
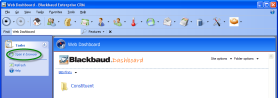
Figure: Navigate to the Web Dashboard Site/Page
Step 2 - Add a new Designations folder within the Web Dashboard website.
Using the Folder options menu, select the Add new folder menu item to add a folder named Designations.
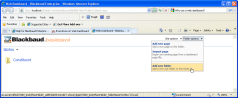
Figure: Add a new folder
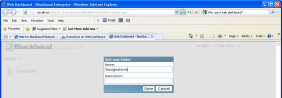
Figure: Add the new Designations folder
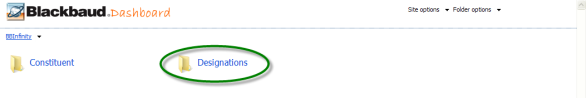
Figure: The new Designations folder
Step 3 - Navigate into the new Designationsfolder and add a new page to the website.
Click the Designations folder (green circle in the figure above) to open the folder. Select Folder Options\Add new Page to begin the process of creating a new web dashboard page. After the page is laid out, we can place data lists, data connectors, and KPI Instances on the page.
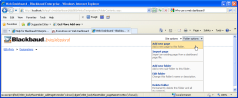
Figure: Create a new page
Use the figure below to fill out the Add new page property window. The web page name should not contain spaces. Since we are creating a web page to display information about designations, we will select Designation as the Context record type. Any web parts that require a context record will receive the context from this web page’s default search list named Designation Search.
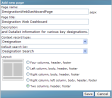
Figure: Add a new page
Click Save to create the new page within the Designation folder. You will see the icon for the new page within the folder:
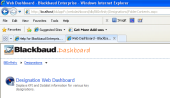
Figure: The newly created Designation Web Dashboard page
Step 4 - Open and configure the new page.
Open the page by clicking the Designation Web Dashboard link/icon. You will be directed to the new page. Not much is on the page at this point; just the page context for designation. Select Edit shared version of this page on the Page options menu. This will enable the page to be configured.
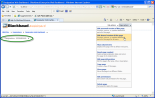
Figure: The new Designation Web Dashboard page with the page context control (green oval) and the Page options menu
The page will now be in a state where web dashboard parts can be added. You can add several different types of dashboard parts such as Data list and KPI web parts.
Step 5 - Add New Web Parts to the Page
Click Add dashboard item.
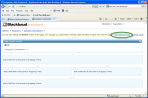
Figure: Add a Dashboard Web Part
The Catalogs screen appears.
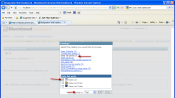
Figure: Selecting the Data List Part from the Catalog of Web Parts
Select the Data list parts link to view a listing of data list parts. When you select a catalog, all the parts available for that type appear.
When you hover the cursor over a part type, a description of the part appears. Mark the checkbox for Data List as the first web part to add. Select Top in the Add to drop down list box. Click the Add button to add the Data list part.
After clicking the Add button, the Data List window will appear. Use the figure below to configure the Data list part to display the Big Spenders Data List we created in the previous exercise. This data list expects a context id with a record type of designation. Click OK to save your changes.
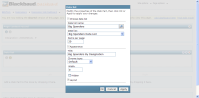
Figure: Configure the data list
Step 6 - Connect the data list to the data.
You will now see the data list has been added to the page (big red rectangle below).
Click the blue light on the data list (red arrow) to begin the process of receiving data from another part that provides data. You will see the yellow light begin to blink on the data list and you will see the blue light begin to blink on the Page Context Record.
This deserves a bit of explanation. Web parts that display data need to receive their data from what is called a ‘data provider’. In our case, when we created the page, we selected designation as the context for the page’s context record. The Page Context Record is a web part that is a data provider for web parts that receive context and data, such as our data list. The Page Context Record control is detecting a signal that the data list is awaiting a connection. Click the yellow light on the Big Spenders By Designation to complete the connection. See figure below.
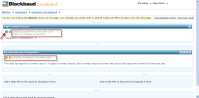
Figure: Connect the Big Spenders by Designation Data List to a data provider web part.
Once the Big Spenders By Designation data list is connected with the appropriate context record provider, the data list will display data for the selected designation context id. The example below displays data for the 2008 Annual Fund designation.
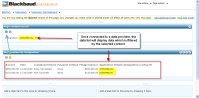
Figure: When Connected, the Data List Displays Rows for the Selected Context ID: 2008 Annual Fund.
Step 7 - Adding a KPI Instance to the dashboard.
Remember the KPI Instance we created in Exercise: Create a KPI Instance from a KPI? We can create a nifty web part from that instance and display it on the dashboard too.
We begin the process of adding the KPI web part to the page the same way we added the data list, by clicking the Add dashboard item link at the top of the page. Go ahead and click the link now.
You will be presented with the Catalogs window. Select KPI parts link followed by selecting KPI Circular Gauge. Add the gauge to the left hand portion of the dashboard. Click Add to add the part. See figure below.
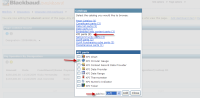
Figure: Add a KPI Circular Gauge Part to the Dashboard
After you click the Add button, you see the KPI circular gauge window. Use the figure below to configure the web part.
The properties are presented here in two windows for brevity.
Click the OK button to add the gauge to the dashboard. In the next step, we will hook up the gauge to a data provider.
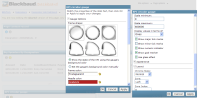
Figure: KPI Circular Gauge properties
Step 8 - Add a data provider for the KPI Instance.
You will now see the new gauge added to the left hand side of the page.
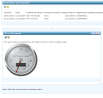
Figure: The new gauge needs to be connected to a KPI data provider
Click the Add dashboard item link in the upper right hand corner of the dashboard to begin the process of adding the KPI Data Provider. Click the KPI Parts link and check KPI Data Provider. Add the part to the left hand side of the page and click the Add button to add the data provider. See figure below.

Figure: Select the KPI Data Provider Web Part for our gauge
You will now see the KPI data provider window. Select the Total Revenue for the Presidents Development Fund KPI Instance and provide a title. Elect to hide the data provider. See Figure below.

Figure: KPI data provider window
Step 9 - Hook up the Data Provider to the KPI Instance Web Part
Click the yellow button/light on the gauge followed by the blue light on the data provider to connect the gauge with the KPI Instance data. When the KPI Instance’s value is updated the gauge will be updated.
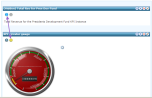
Figure: Connect the gauge to the data
Step 10 - Exit edit mode
Click the Exit edit mode link in the upper right hand side of the page to exit edit mode.
Figure: Exit edit mode
Figure: The completed dashboard