Insights
Report builder includes a list of out-of-the-box insights you can use to create your dashboards.
For more information about out-of-the-box insights, see Constituent Insights and Gift Insights.
For detailed recipes for creating custom gift insights, see Gift Insight Recipes.
Facts are the numerical amounts and percentages you track with an insight. In the data catalogue, facts appear under all data or facts. For comparison, you can include multiple facts in an insight.
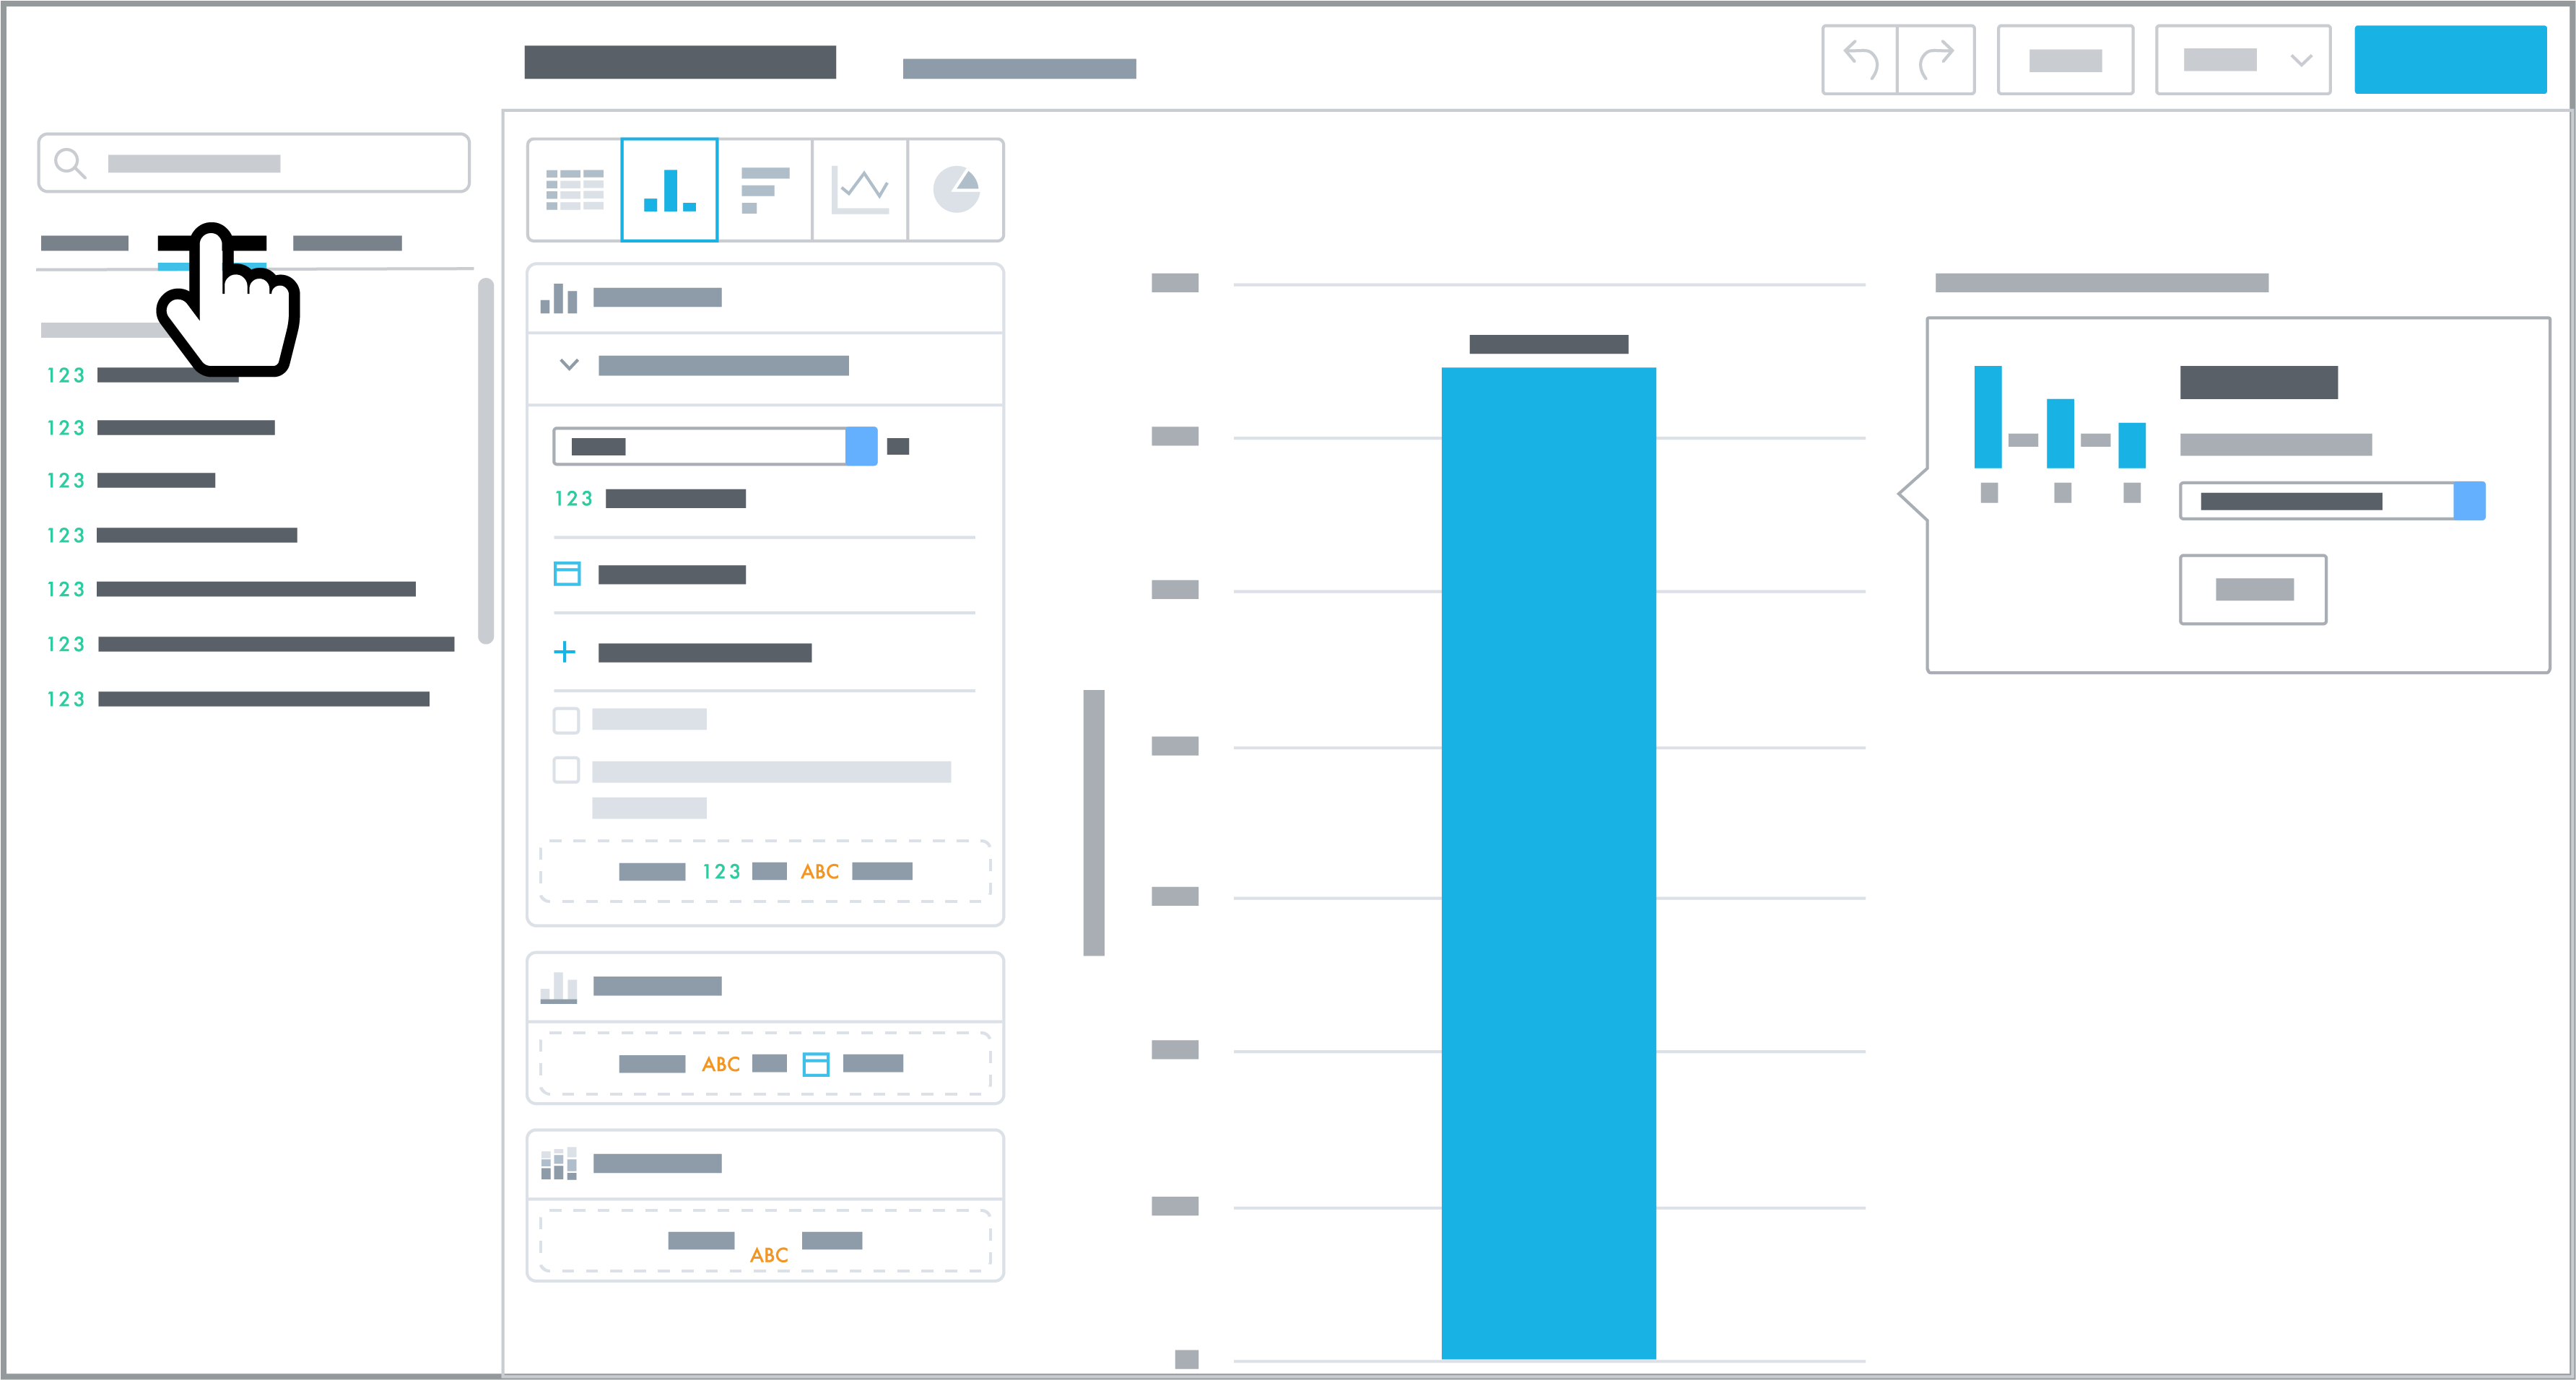
By default, each fact provides the sum or count of all its records.
-
To analyze a different amount, select the fact and choose which calculation to use from the drop-down menu. For example, you may choose Average or Running sum.
-
To narrow the focus of a fact, add an attribute filter and choose the criteria of the records to include. To add an attribute filter, select the fact and select the plus sign next to Add attribute filter.
For further analysis, you can apply attributes to break facts down by related criteria or characteristics. You can also apply a Date attribute to analyze by time period such as fiscal year. In the data catalogue, attributes appear under their own tab.
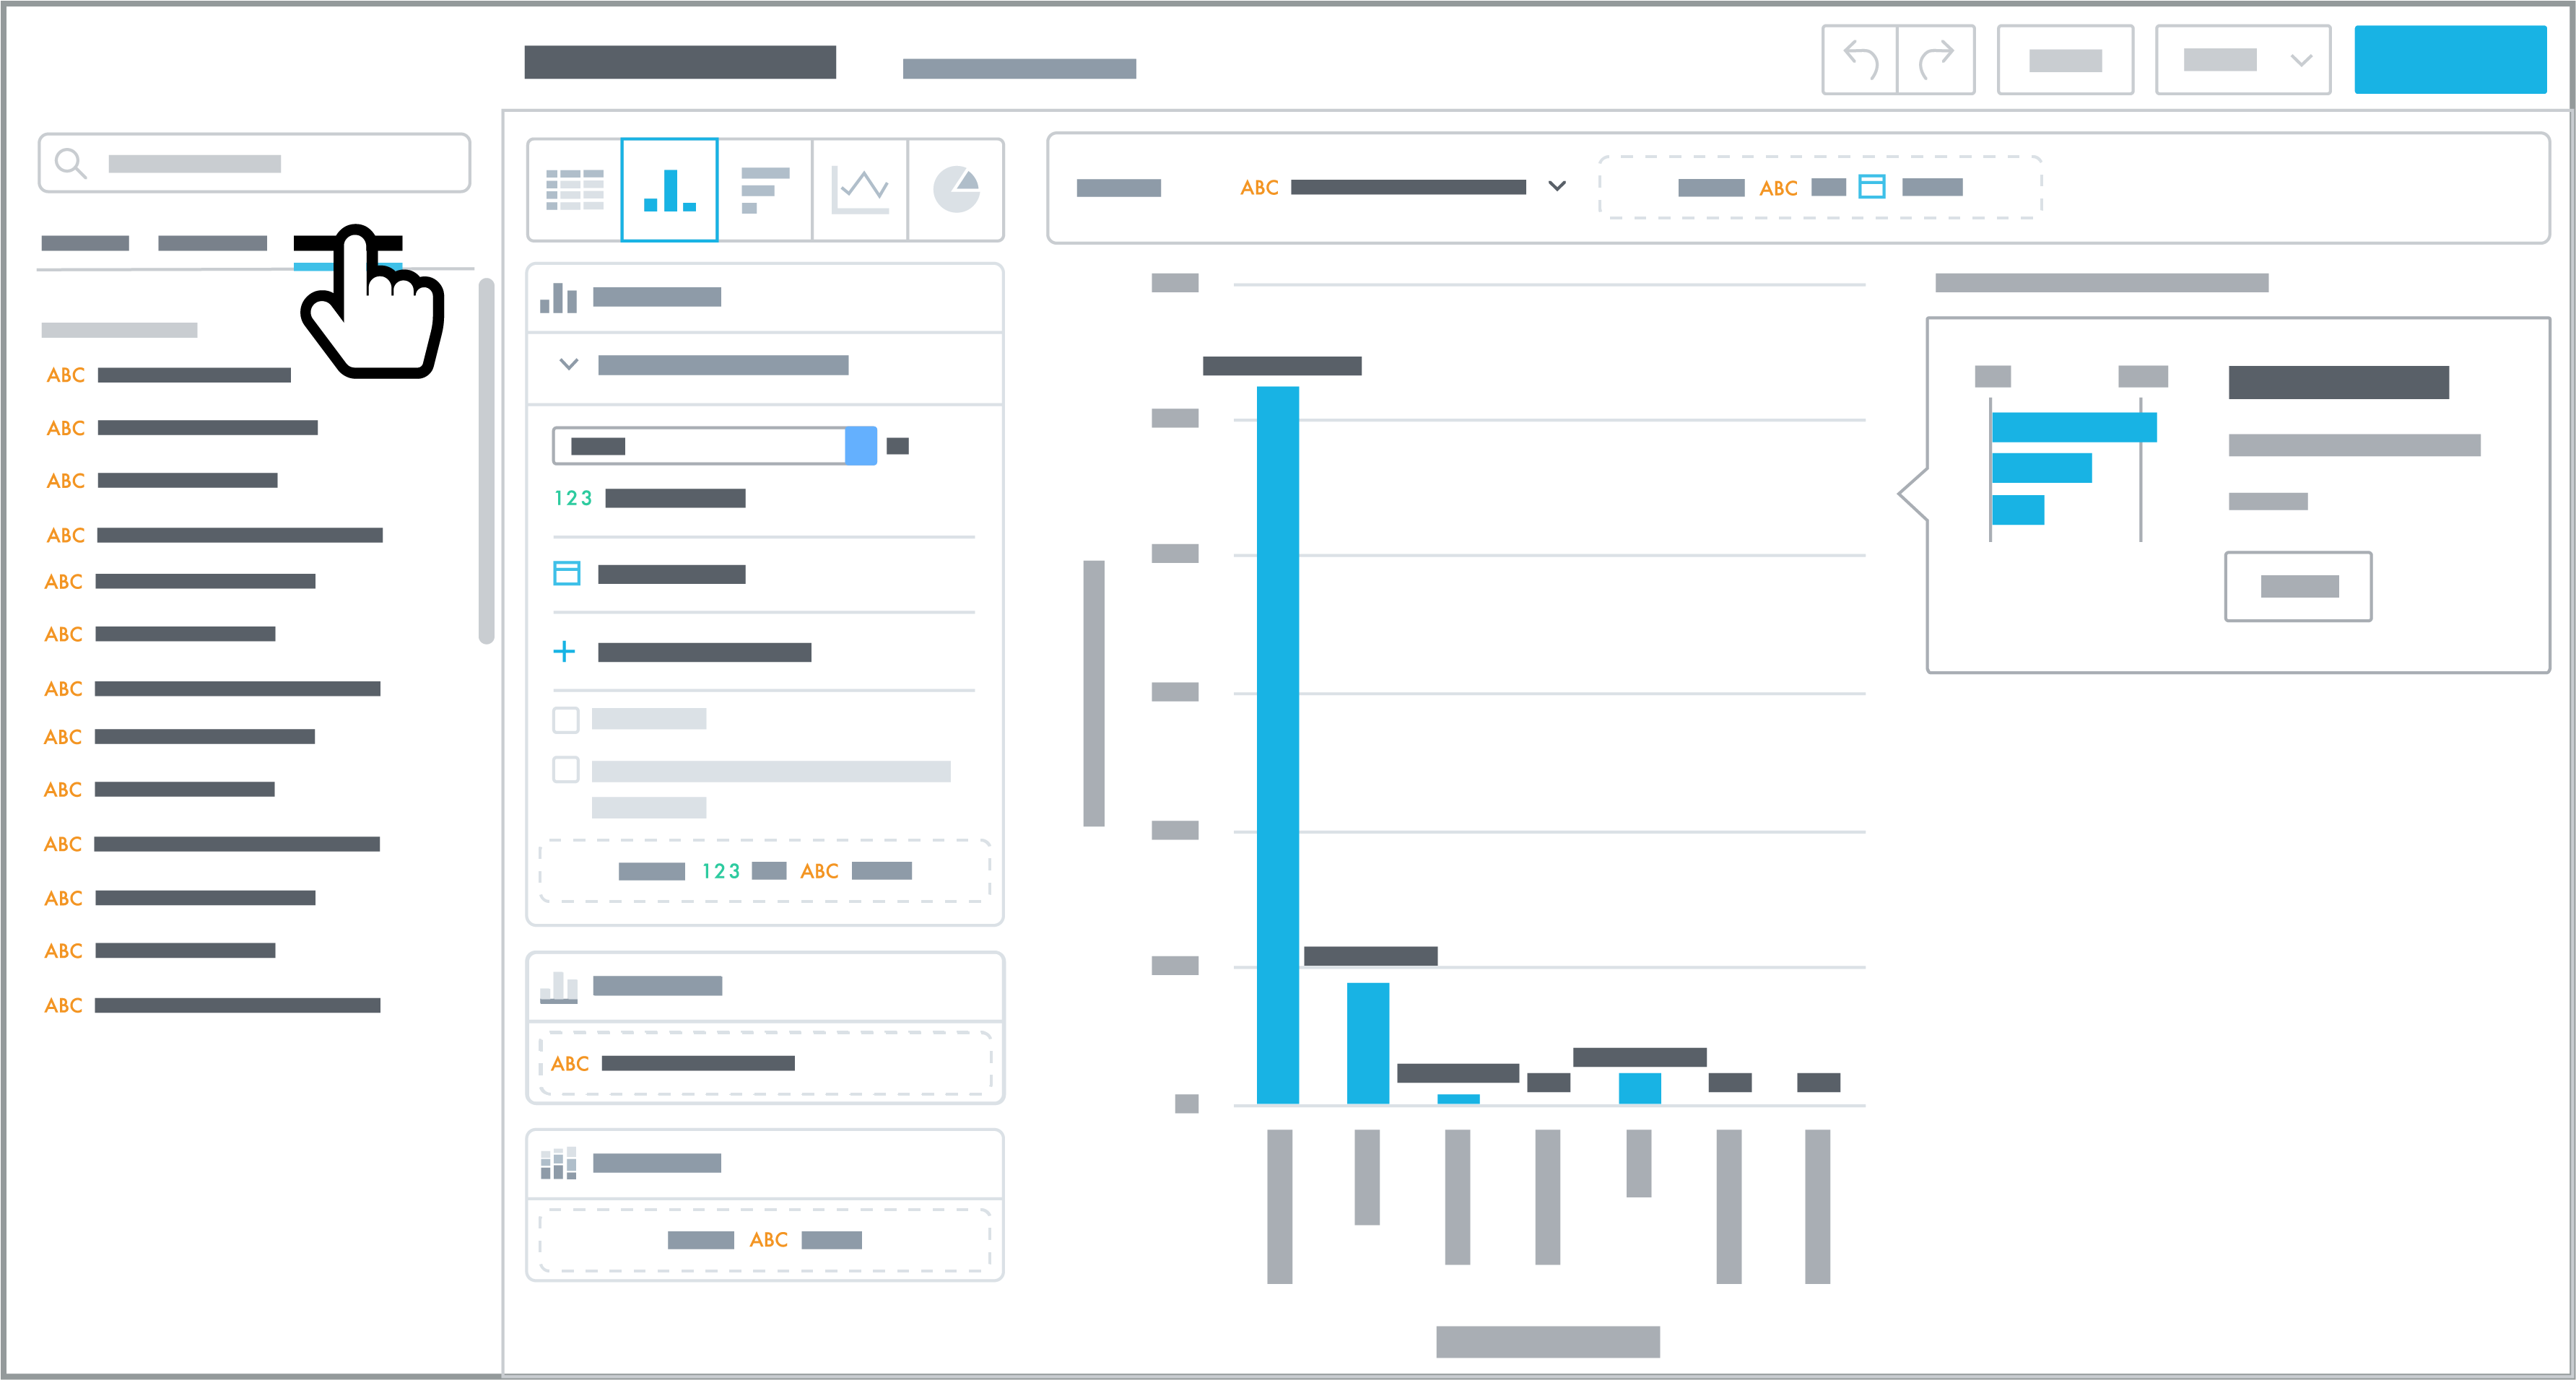
To build a new insight, move a fact or attribute to Facts and follow the recommended next steps, or design the insight as a table, column chart, bar chart line chart, pie chart, or headline. For more information, see Insight Properties.
Tip: Mess up as you design or edit an insight? No worries! Select Undo or Redo to remove or return recent changes. To completely start over, select Clear to remove all facts and attributes.
To view a saved insight, select the name from the Insights list.
Tip: To quickly find an insight, search for it by name.
-
After you open an insight, Insight designer allows you to edit its facts, attributes, or filters as necessary. To update the same insight with your changes, select Save.
-
To create a new insight based on the open one, select Save as new, enter a unique name to identify the insight, and select Save. This can be useful if you want to use an out-of-the-box insight but want to customize any of the options.
To remove an insight you no longer need, you can delete it. From the insights list, select Delete from the menu  .
.
Note: You cannot delete out-of-the-box insights. You can only delete insights that you or someone in your organization created.
When creating an insight, you can drag it from the Facts box to the left navigation to delete it. You can also select Clear to delete the insight.
Note: Admins! To enable people at your organization to create their own insights, you must first choose which security groups should have permission to manage insights and dashboards.